Merchandisers around the world agree that the right product assortment plays a crucial role in retail success. Successfully analyzing in-store conditions in the context of sales and space helps brands improve productivity, earn higher returns and gain loyalty.
Why shelf data is important for category management and space planning?
Retail space is limited and highly expensive. Hence, retailers aim to place the right products in the right place and quantity to increase visibility and sales. A common criterion used by them to identify their best-selling products and optimize category management is unit sales volume or profit. Although analyzing sales based on attributes like product type, color, or SKU, can provide useful insights to category managers, it can leave many questions unanswered. For instance,
· Which brands and SKUs are under or over-represented?
· What is the assortment gain/loss over time?
· What is the level of competition for brands?
· What is the share of space for a brand/ category within a key customer segment?
In order to answer these questions correctly, retailers need shelf intelligence made available by collecting and analyzing accurate, and current data. Not just that, by combining shelf data with other datasets and envisioning it on an interactive dashboard allow retailers to optimize facings batter, decide product placement based on customer perspective and display products that are apt to the category. Using intelligent space planning solutions like planograms is a practical approach to achieve these.
So how does a planogram work? Planograms are visual representations that indicate how products should be placed on retail shelves or the entire store. It helps in utilizing every inch of the available retail space to provide better shopping experiences?to customers based on their?demands, shopping habits, demographics, and other factors.?Planograms help create value for?customers?resulting in improved customer loyalty?and ensures proper inventory management thus eliminating out-of-stocks. Additionally, planograms also generate sales analysis, space analysis and capacity analysis reports based on data fed into it. Let us now understand what these reports are, and how they are beneficial in optimizing category management.
1.Sales Analysis report
Among all the three reports available, sales report is of highest value to retailers. A sales report provides an overview of all products in a planogram along with its facings, sales value, sales volume as well as sales profit. Additionally, it also helps retailers in understanding the movement of products on specific shelves so that they can decide which products should be placed on which shelf. Additionally, a comparison between sales report and space report shows retailer how much sales a product generates compared to the space it takes up. Assortment range can be optimized by selecting products that bring in good sales relative to the space they take up.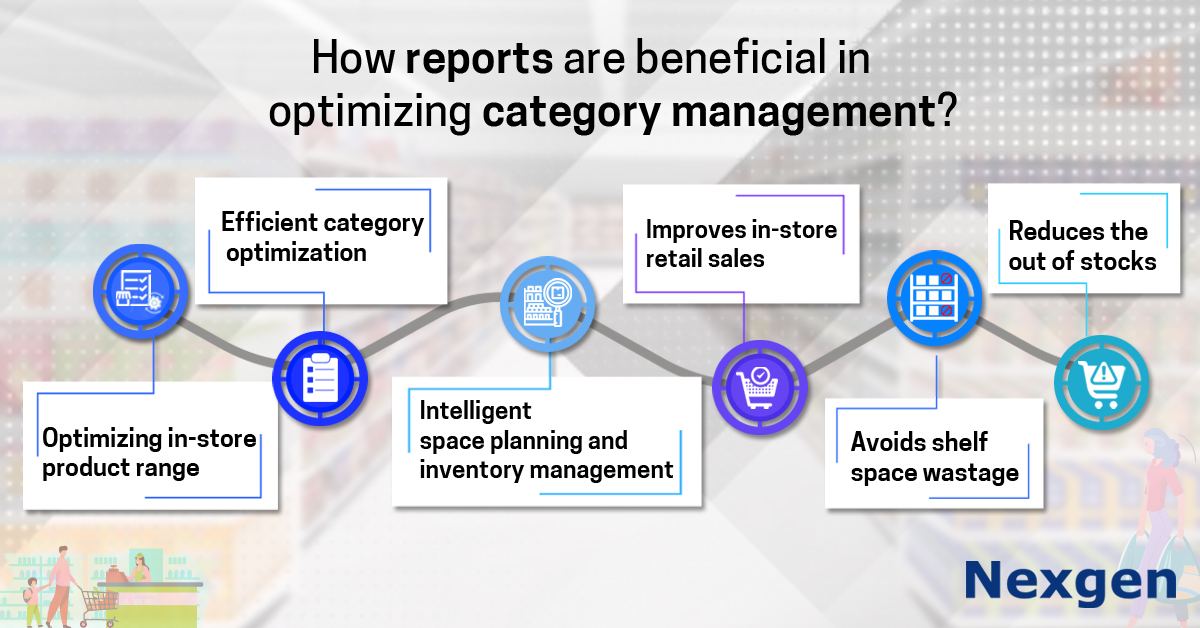
2. Space Analysis report
The space analysis report allows retailers to calculate total shelf space available along with space share for each product. It consists of information about length and breadth of a shelf, number of product facings as well as the percentage of space taken up by each product on the shelf, section and planogram in total. Analyzing space report provides useful insights about the space allocated for each product and brand. Additionally, retailers can get an idea of total space share for each product and determine how to display their products to ensure category optimization and maximize space utilization.
3. Capacity analysis report
The capacity analysis considers height, width and depth of the shelf, total volume occupied by each product along with free space. It also helps measure the space utilized by each brand with respect to total capacity and percentage share of space and compares it with total space used by all products. By analyzing total space used by each product, category managers can rearrange a planogram in a way to avoid low margin products taking up too much of shelf space. The reports also help control total space utilized and avoid shelf space wastage.
Overview of Nexgen POG
Nexgen POG?is a robust and user-friendly cloud-based visual merchandising tool.? It is designed for quick and efficient planogramming with minimal effort.?Planograms can be designed by easily dragging and dropping the products. Multi-device compatibility feature of POG allows you to?obtain,?share and edit planograms on any device?including?your phone.?It helps in designing store-specific planograms for increased product visibility and sales.??
Features of Nexgen POG??
- Customizable templates?
- Compatible?with other?planogram?files?
- Quick and easy compliance?
- Bulk upload of images
- Automated planograms?
Get Your Free Trial Now!
