Reading a planogram is a crucial step towards retail optimization in order to reap its full benefits. Planograms are important merchandising tools for communicating shelf plans. This will indicate the optimal location of every SKU in the store. While designing planograms, one must understand that it is not a one-size-fits-all process. Each retailer has his own different goals and needs. This means they must adopt a personalized approach to planogram generation. However, when read and analyzed correctly, planograms can provide more useful information than just how products should be arranged on shelves. The digitally created layout allows retailers to organize products in a way that best serves their goals, increase profit margins, boost the sales of a specific brand, or direct shoppers through a retail space. The following factors must be considered before, during, and after the planogram generation process:
1. What do you need to arrange before reading planograms?
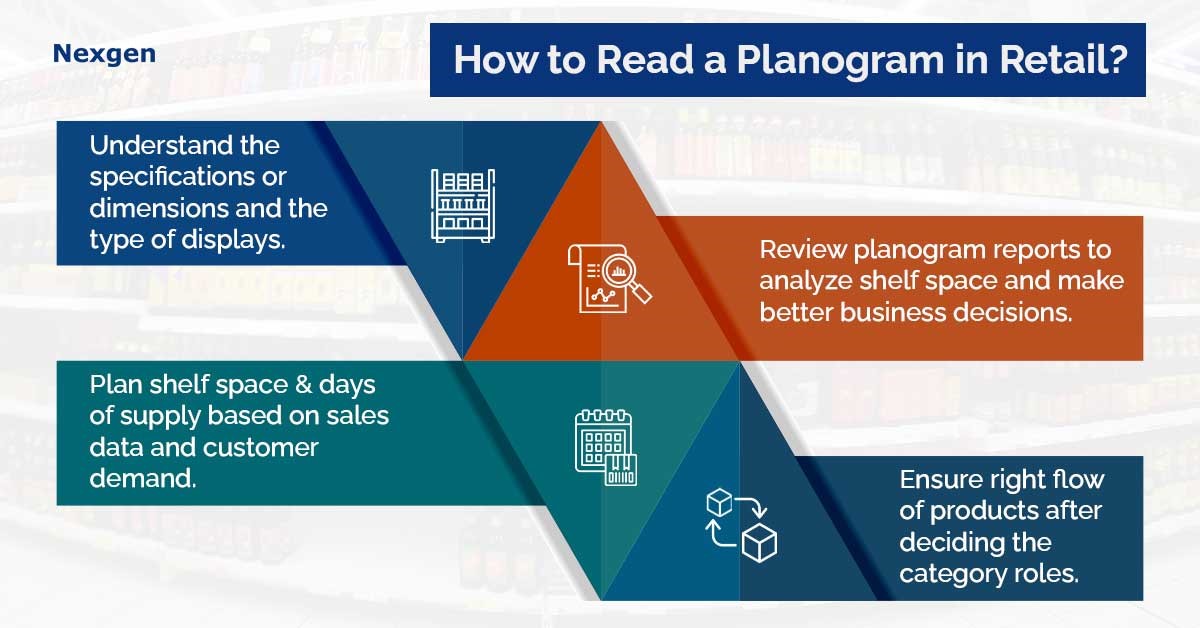
Before a planogram is created, a few elements must be in place to ensure that it can be understood correctly. As a retailer, you must first make sure that the data being used is accurate. This indicates that there are no errors such as duplicate values, commas, or inaccurate period information on planograms. You must also be aware of the category roles, tactics, and strategies to ensure that they are reflected in the planogram. Thus, data-driven shelf layouts can help accomplish retail goals. You must choose the flow of products on the planogram after deciding the category roles.
The retailer's merchandising principles are essential for the planogram to make sense, and elements like merchandising pack sizes from small to large must be followed and adhered to frequently. The readability of a planogram depends on whether it is based on a cluster or not. For example, a planogram created for one region cannot make sense if it is used in a store at another location. In addition, the measurement of a store’s fixture must be accurate. This significantly impacts factors such as the number of facings and the capacity of items. Moreover, using high-quality, precise product images is essential to making the planogram readable and understandable.
2. What do you need to do when creating your planogram?
When creating a planogram, it is important to consider how the planograms will be read and understood. First, it is necessary to understand the specifications, dimensions, and type of display used to create a planogram, such as gondolas, coolers, slatwalls, or pegboards. After that, you must consider the correct product flow and ensure that it makes sense. This will make your planogram simple and easy to follow. You must also consider factors related to retail shelf space, such as days for supply analysis. It helps retailers understand how many days the current stock will last, based on sales data and customer demand. This will help ensure that planograms are data-driven and relevant. Also, products must be placed on the planogram using the correct merchandising rules. For example, bestsellers should ideally be placed at eye level.
3. What are the results of doing all the above?
To make the planogram easier to read and understand, Nexgen POG’s reporting function can be used to review the product and fixture details to understand the top- and low-level performing SKUs. This helps retailers view reports such as product summary, product list by shelf, product list by manufacturer or brand, and custom reports such as space analysis, capacity analysis and sales analysis that can be used to analyze shelf space and make better business decisions.
- The space analysis report allows the retailer to calculate the total shelf space available along with the space shared for each product. It includes details like the length and breadth of the shelf, number of product facings and the percentage of space taken up by each product on the shelf, section, and planogram in total.
- The capacity analysis report provides the retailer with the height, width, and depth of the shelf, and the total volume occupied by each product along with free space. This helps measure the space utilized by each brand with respect to the total capacity and percentage share of space and compares it with the total space used by all products.
- The sales analysis report is the most important report for most retailers. It provides an overview of all products in a planogram, along with their facings, sales value, sales volume, and profit. It also helps retailers in understanding the movement of items on specific shelves so that they can decide which items should be placed on which shelves. For example, if a retailer finds out that the sale of a product is low due to decreased demand or availability of better alternatives, he can reduce the number of facings for the product on the shelves and provide more space for best-selling products. Therefore, sales analysis reports will help category managers design planograms in such a way to boost sales by strategically positioning items.
Overview of Nexgen POG
Nexgen POG is a robust and user-friendly cloud-based visual merchandising tool. It is designed for quick and efficient planogramming with minimal effort. Planogram in retail can be designed by easily dragging and dropping the products. The multi-device compatibility feature of POG allows you to obtain, share and edit planogram on any device, including your phone. It helps in designing store-specific planograms for increased product visibility and sales.
Get Your Free Trial Now!
